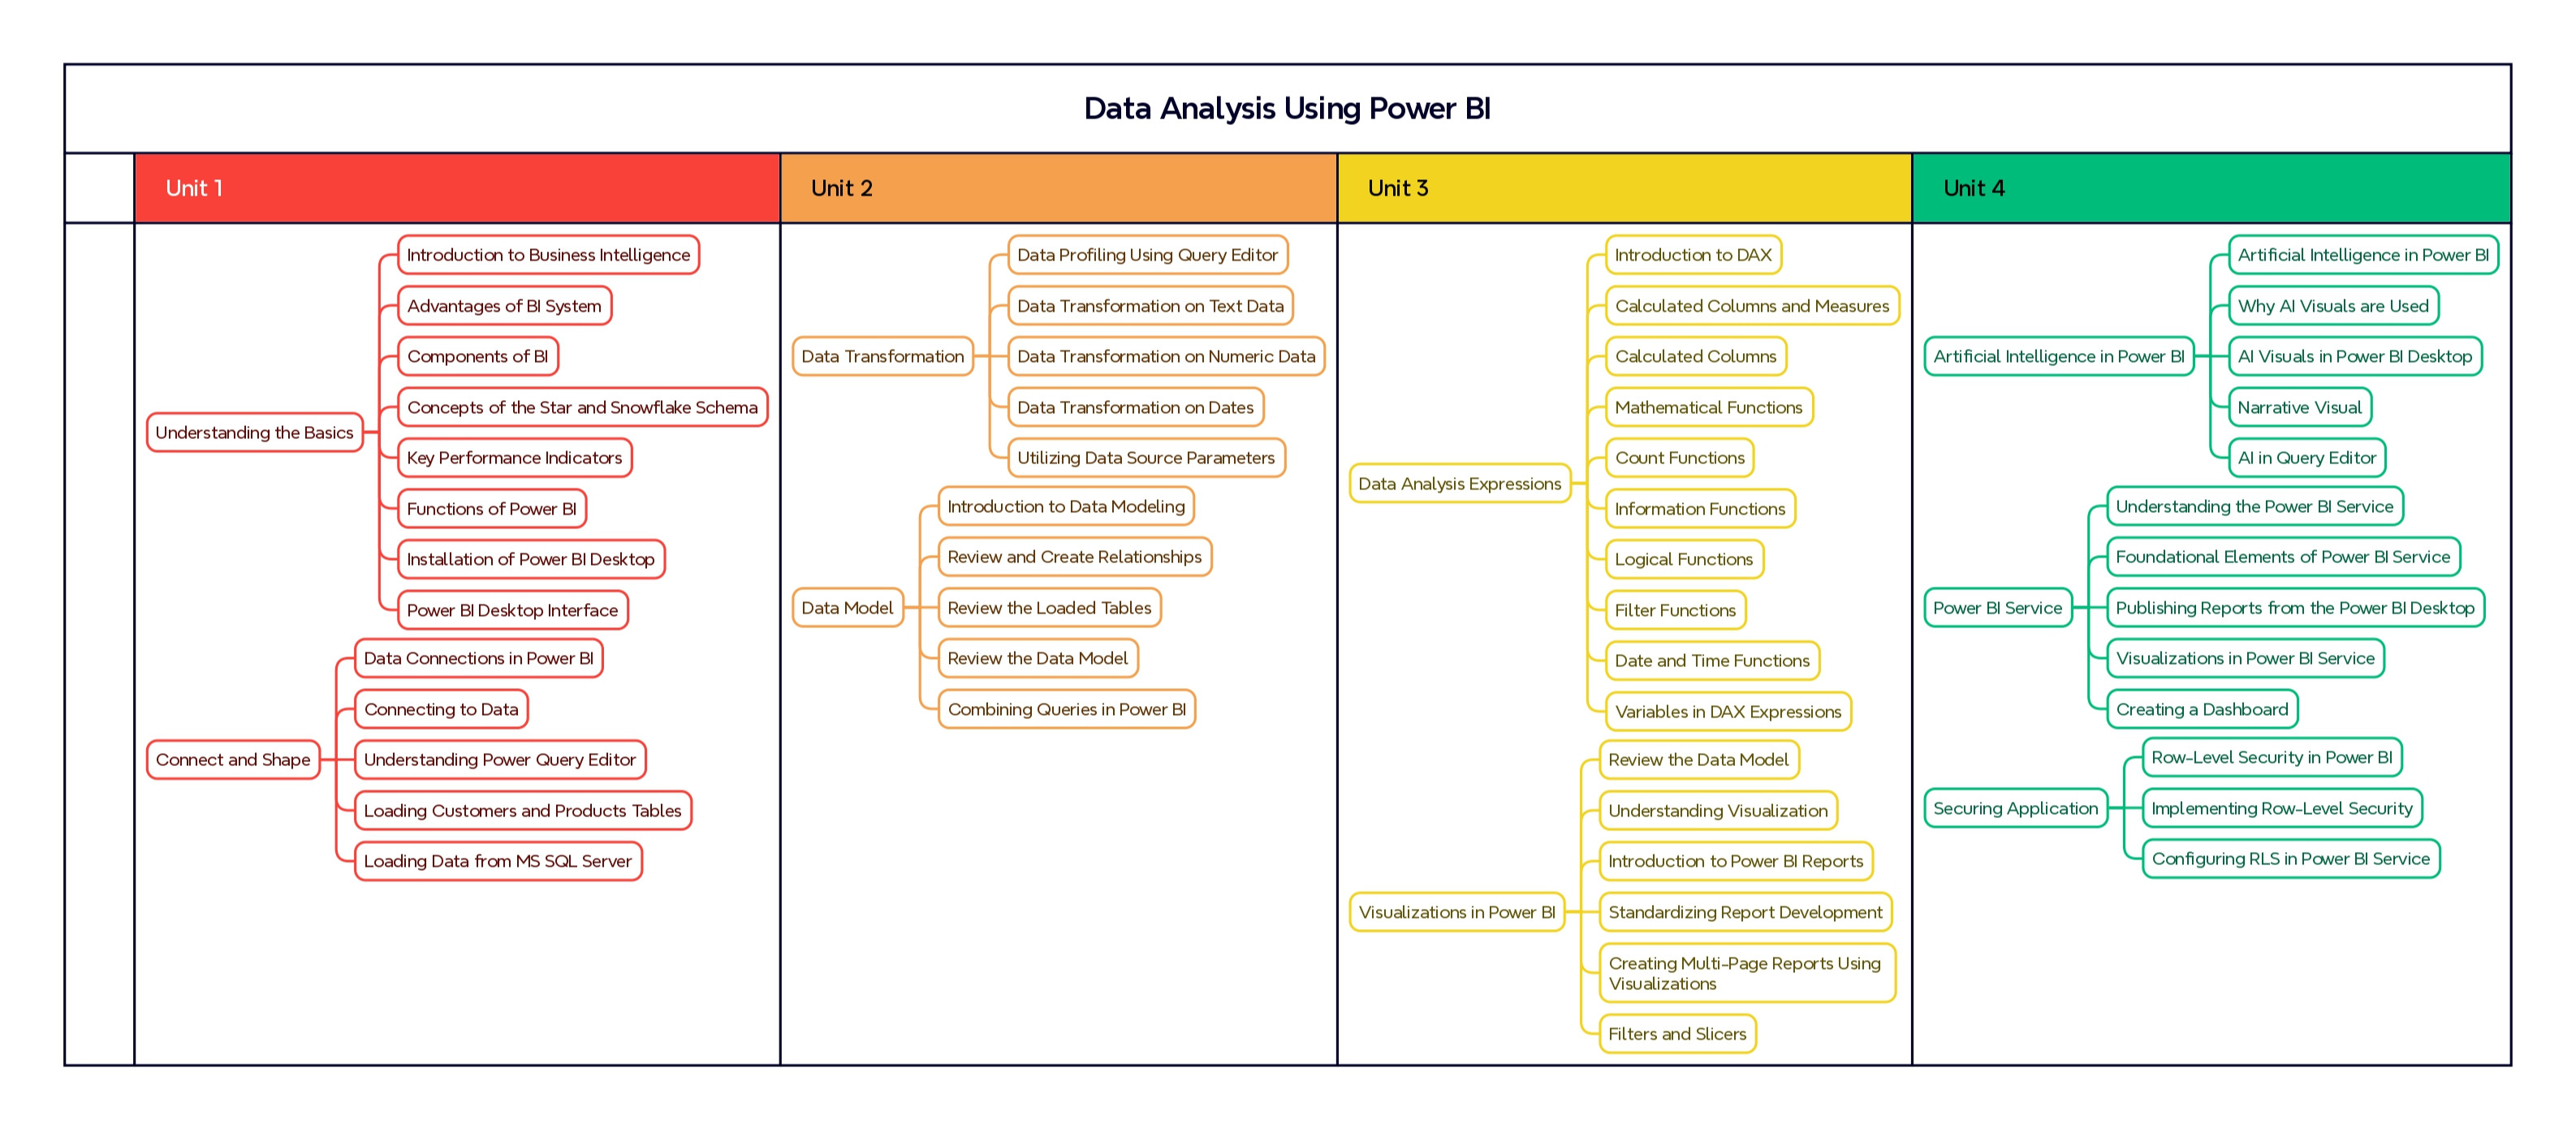
- Unit I
- Understanding the Basics
- Introduction to Business Intelligence
- Advantages of BI System
- Components of BI
- Concepts of the Star and Snowflake Schema
- Key Performance Indicators
- Functions of Power BI
- Installation of Power BI Desktop
- Power BI Desktop Interface
- Connect and Shape
- Data Connections in Power BI
- Connecting to Data
- Understanding Power Query Editor
- Loading Customers and Products Tables
- Loading Data from MS SQL Server
- Unit II
- Data Transformation
- Data Profiling Using Query Editor
- Data Transformation on Text Data
- Data Transformation on Numeric Data
- Data Transformation on Dates
- Utilizing Data Source Parameters
- Data Model
- Introduction to Data Modeling
- Review and Create Relationships
- Review the Loaded Tables
- Review the Data Model
- Combining Queries in Power BI
- Unit III
- Data Analysis Expressions
- Introduction to DAX
- Calculated Columns and Measures
- Calculated Columns
- Mathematical Functions
- Count Functions
- Information Functions
- Logial Functions
- Filter Functions
- Date and Time Functions
- Variables in DAX Expressions
- Visualization in Power BI
- Review the Data Model
- Understanding Visualization
- Introduction to Power BI Reports
- Standardizing Report Development
- Creating Multi-Page Reports Using Visualizations
- Filters and Slicers
- Unit IV
- Artificial Intelligence in Power BI
- Artificial Intelligence in Power BI
- Why AI Visuals are Used
- AI Visuals in Power BI Desktop
- Narrative Visual
- AI in Query Editor
- Power BI Service
- Understanding the Power BI Service
- Foundational Elements of Power BI Service
- Publishing Reports from the Power BI Desktop
- Visualizations in Power BI Service
- Creating a Dashboard
- Securing Application
- Row-Level Security in Power BI
- Implementing Row-Level Security
- Configuring RLS in Power BI Service